The Revolution of Football Statistics
Football statistics are everywhere – from small si


Football statistics are everywhere – from small sites with live stats for regional matches to huge online platforms with predictions and expert analytics. The advancement of data analytics, machine learning, statistical modelling, and AI predictions has progressed drastically to give more precise football predictions.
Here is a real case for you – the recently introduced physics-inspired algorithms can simulate the matches of local and international football leagues using dynamic team adjustments. Such models define each team’s potential, both attacking and defensive, updated after each match based on the performance of every player.
Science and Passion as Major Elements of Real-Time Football Stats
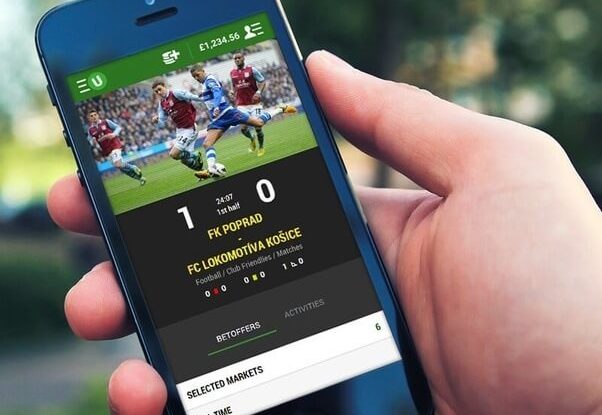
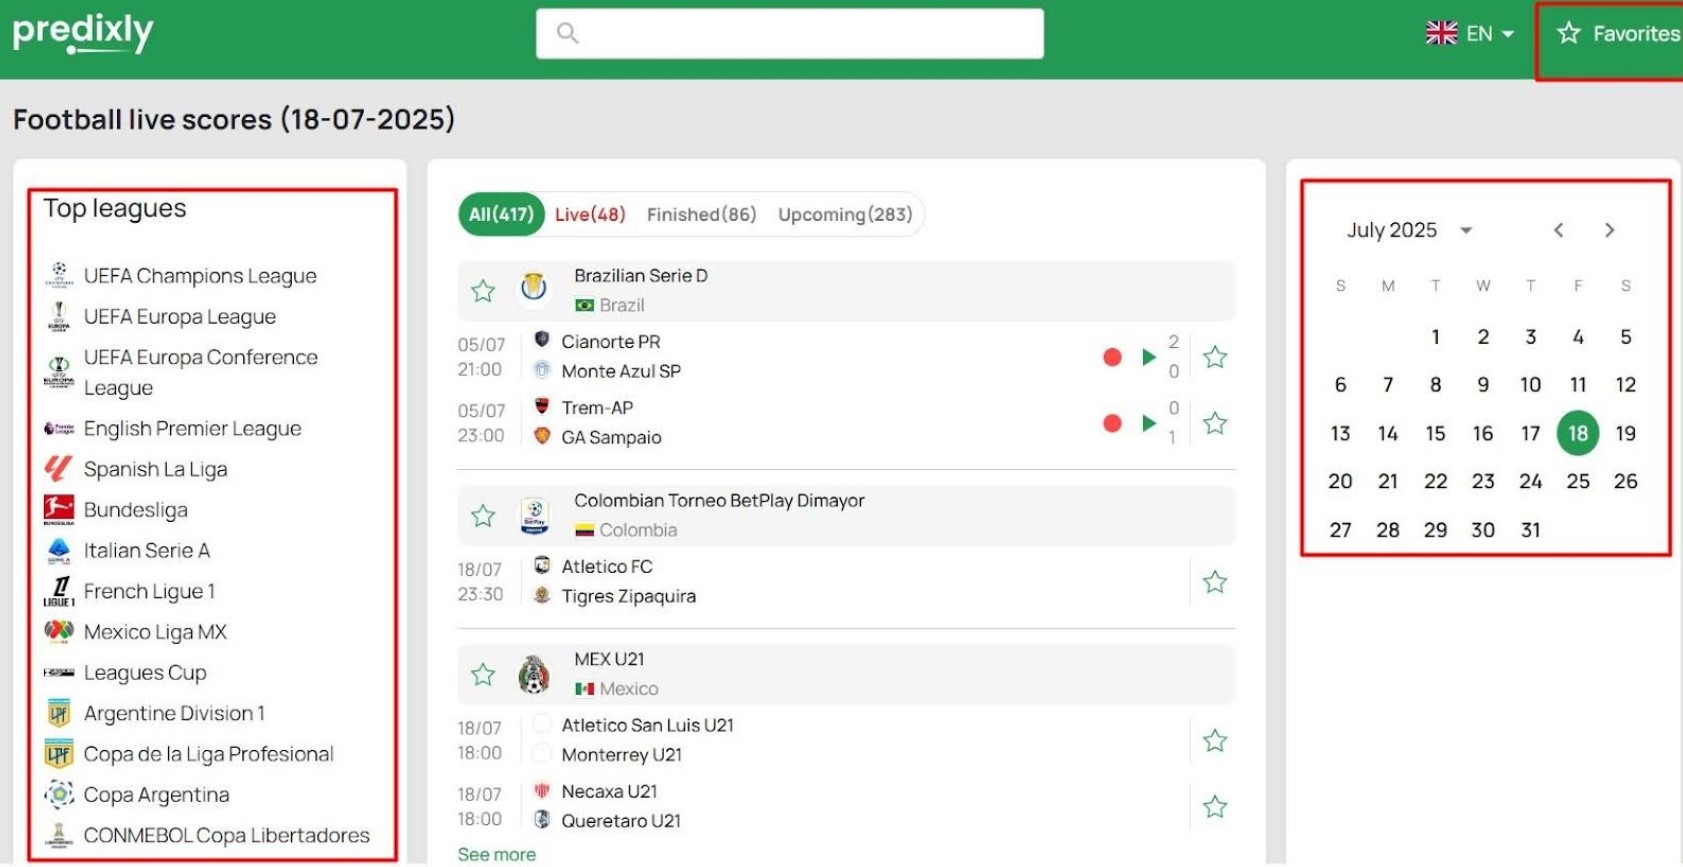
This scientific approach relies on the real-time statistics provided by experts of football-centric platforms. For example, football live scores on Predixly can provide a more comprehensive view of the team’s performance and each player’s statistics, based on both past and live achievements in every match. Combined with passion and dedication to football’s history, such a scientific approach can pave the way to a new method of football real-time analytics.
Data Collection – The Foundation of Real-Time Football Insights
Real-time football statistics science starts with data collection which has undergone a tremendous change thanks to a few factors like:
- Authoritative sources such as football federations, leagues and referee services offer event-by-event data in real time. Using these official sources, fans and analysts can track down the match’s goals, fouls, and substitutions;
- Superior tracking technologies like optical systems and wearable devices track the movements of players and balls accurately. For example, high-resolution cameras are used in optical tracking systems, such as those found in the highest leagues, to track the location of players, their speeds, and distances travelled, producing data in near real-time (1-3 seconds);
- Physiological metrics such as heart rate and sprint distance are monitored by wearable devices. While GPS and inertial measurement units (IMUs) provide information on player exertion.
The technologies generate massive amounts of data, sometimes more than millions of data points per match. Such methods allow recording each pass, tackle and shot with contextual data such as player location and game phase. This fine-grained data is the foundation of real-time analytics, which allows platforms to provide real-time insights.
Data Processing – Turning Raw Data into Meaningful Football Metrics
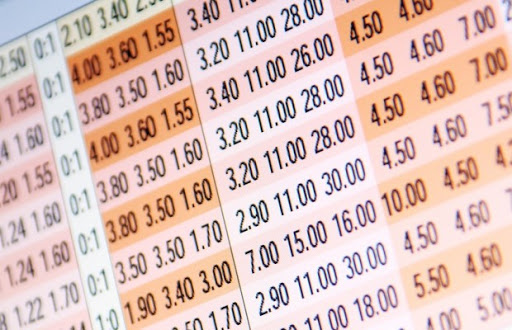
All these massive amounts of collected data require complex algorithms to estimate such key football metrics as goal possession, xG, and pass accuracy. An example of such goals is expected goals (xG), which is calculated with logistic regression or neural networks, based on shot details (e.g., distance, angle, type) to predict the likelihood of scoring. On average, the xG models generally give a penalty a 0.76 chance of being scored, based on the past historical data of thousands of shots.
Real-time processing is a scientific achievement, which is a balance between speed and accuracy. Algorithms need to process data streams of high frequencies, sometimes thousands of events per second, with a minimal number of errors.
Machine learning methods are becoming more common to handle complex tactical data, including team centroids (a geometric center of player positions). Such models allow online analytical platforms (like Predixly.com) to provide such statistics as possession tendencies or dangerous attacks in a matter of seconds. This approach can be essential in the decision-making process during the match.
Data Visualization – Making Football Stats Accessible
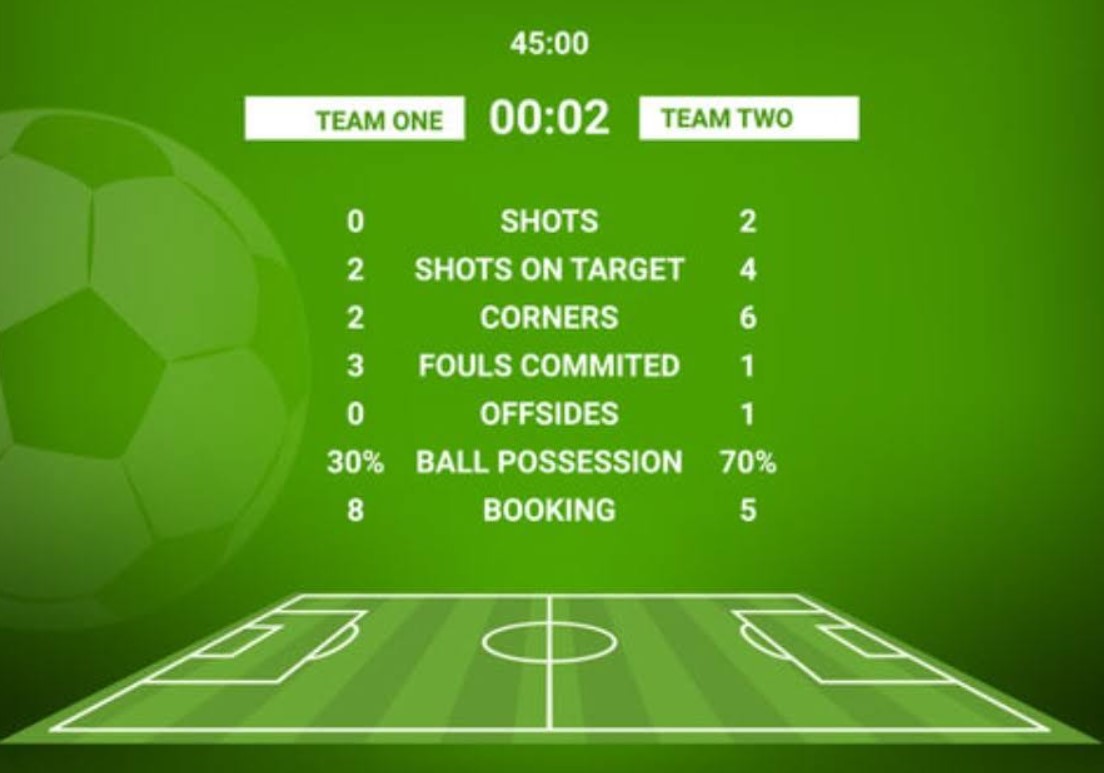
The place where science and usability meet is visualization. Data is presented in an intuitive manner using graphs, heatmaps, and timelines on platforms. As an example, activity graphs display attacks per minute, displaying the change in momentum, while heatmaps display player movement or goal distribution.
Such visualizations are based on scientific principles of data representation, which are not overloaded and easy to understand. An example is color-coded event timelines (e.g. green for goals, red for cards) that help fans to follow the progress of a match at a glance, and heatmaps to analyse spatial trends.

Passion’s Role in Football Analysis
Data scientists and analysts have an enthusiastic attitude to the discovery of insights. This passion drives innovation, as researchers come up with new measures such as team centroids or match phase annotations to measure the complexity of the game.
The interest of analysts in actionable insights is clear. As an illustration, a Barca Innovation Hub article published in 2019 highlighted that data scientists at FC Barcelona are interested in contextual analysis. They have proved that wingers are performing better against organized defenses, based on a motivation to improve the performance of the team.
Summing up, it is important to combine passion and science in equal measures when it comes to offering football analytical insights to fans, coaches, players and majors.