How xG And xGA Help Identify Overrated And Underrated Teams
xG and xGA are not “magic numbers.” They measure c


xG and xGA are not “magic numbers.” They measure chance quality, not the scoreline. The scoreboard often lies. A shot with a 3% chance can still go in. Two deflections can flip a match. xG filters out that noise.
xG (expected goals) shows how many goals a team should have scored based on the quality of its chances.
xGA shows how many goals a team should have conceded based on the chances it allowed.
Think of it like this: don’t look at the receipt, look at the shopping cart. The receipt changes because of discounts and luck. The cart shows what you actually bought.
This is why xG and xGA matter when looking for overrated and underrated teams.
An overrated team often wins despite weak chance creation. Penalties, long shots, goalkeeper heroics carry results. It looks impressive. It rarely lasts.
An underrated team does the opposite. It creates chances but fails to score. Or it defends well but still concedes. Results lag behind performance.
xG and xGA help you:
- separate structure from luck;
- spot distortions before the table shows them;
- understand where results rest on unstable ground.
What xG And xGA Measure (And What They Don’t)
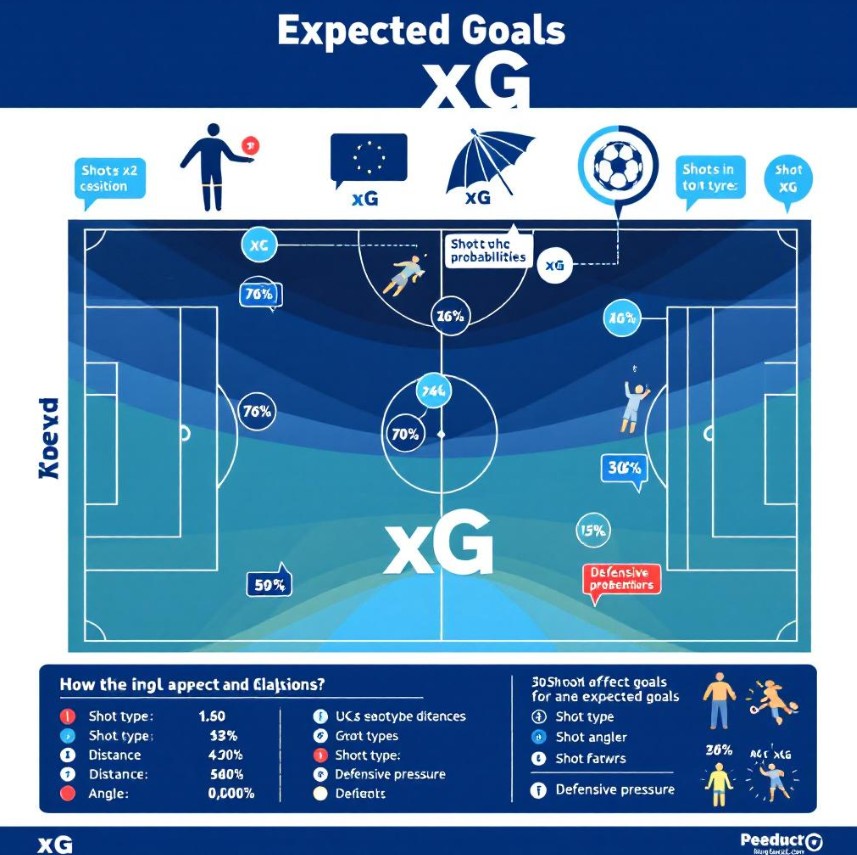
xG estimates the probability that a shot becomes a goal.
It ignores names. It focuses on situations.
Most models account for:
- distance to goal;
- shooting angle;
- shot type;
- assist type;
- defensive pressure;
- phase of play.
Each shot gets a value.
A tap-in scores high.
A long-range attempt scores low.
Add those values together and you get a clear picture of chance creation, not match outcome.
xGA mirrors the same logic for shots conceded. It tells you how dangerous the chances against a team really were.
Their real value lies in forecasting.
If a team keeps creating chances and not scoring, improvement becomes more likely.
If a team keeps allowing chances and not conceding, collapse risk grows.
That’s why xG and xGA help anticipate future events, not just explain the past. These insights can be used in practice on platforms where probability matters, including analytical environments such as bc game apk.
Still, limits exist.
xG does not see shot placement.
It cannot fully price elite finishing or goalkeeping.
It’s a thermometer, not a diagnosis.
How xG And xGA Help Identify Overrated Teams
An overrated team gets results ahead of performance. The table looks good. The data does not.
When a team consistently scores more than its xG, it relies on fragile factors. Finishing streaks. Deflections. Opponent mistakes. These rarely persist.
xGA sharpens the signal. If a team concedes fewer goals than its xGA suggests, it depends on goalkeeper form or opponent wastefulness. That’s not control. That’s deviation.
The classic overrated profile:
- goals scored above xG;
- goals conceded below xGA;
- long runs of narrow wins.
Markets love these teams. They look “solid.”
xG and xGA show the truth: the foundation is thinner than it appears.
How xG And xGA Help Identify Underrated Teams
An underrated team plays better than its results. It may sit low in the table while consistently creating danger.
If a team’s xG stays above its goals scored, the issue is usually finishing. Finishing is volatile. It almost always normalizes.
If xGA stays below goals conceded, the team suffers from noise. Set pieces. Deflections. One-off errors.
This pattern is easier to read in a table:
| Indicator | What You See | What It Means |
|---|---|---|
| xG above goals | Chances without conversion | Below-average finishing |
| xGA below goals conceded | Opponents score “extra” | Bad luck |
| Positive xG − xGA | Chance dominance | Performance > results |
| Poor run with stable xG | Results lag process | Upside potential |
These teams often surge suddenly. Not because they improve overnight. Because results catch up to performance.
Common Mistakes When Using xG And xGA
“Statistics don’t replace thinking. They punish those who don’t think.”
The first mistake is sample size. One match means nothing. xG speaks in sequences.
The second is blind trust in the number. Always check how xG was built.
The third is ignoring context: score effects and playing style matter.
The fourth is chasing certainty.
xG and xGA don’t predict scores.
They shift probabilities.
How To Apply xG And xGA In Practice
Practical use starts with comparing expectations to outcomes. Large, persistent gaps tend to close.
Think in probabilities, not verdicts. xG doesn’t say “win.” It says “more or less likely.”
These insights matter most when applied consistently. On platforms where calculation beats instinct. Environments like bc game reward this approach.
Discipline is the edge.
- No emotional overrides.
- No narrative chasing.
- No belief in miracles.
Summary And xG/xGA Checklist
xG and xGA provide a thinking framework.
Use them to:
- separate results from performance;
- detect hidden distortions;
- work with probabilities;
- spot future shifts early.
Before drawing conclusions, check:
- sample size;
- gap persistence;
- style and score effects;
- pattern repetition.
If these align, you’re seeing a trend.
When xG And xGA Stop Working Well
xG and xGA weaken during major disruptions, extreme styles, short tournaments, or when rare elite finishers dominate.
| Situation | Why It Distorts | What To Do |
|---|---|---|
| Coaching change | Old data no longer fits | Wait for new matches |
| Counter-attacking style | Few but clean chances | Add manual review |
| Cup competitions | Too little data | Use xG as background |
| Star finishers | Above-average conversion | Test over longer runs |
xG works best in stable environments.
Practical Example: Step-By-Step Team Analysis

A team sits near the bottom after eight matches. It scored 6 goals from 11.2 xG and conceded 10 from 7.4 xGA. That’s a clear imbalance.
In six matches, the team won the xG battle. Chances came from the box, through cutbacks, without padding. The defense didn’t collapse; goals came from isolated moments.
The squad stayed stable. The coach remained. No external distortion.
Historically, teams with this profile improve points output over the next 5–10 matches. Not through magic. Through regression to the mean.
xG and xGA revealed this before the table did.
Conclusion
xG and xGA don’t make football predictable.
They make it understandable.
They strip away noise and expose process.
They don’t promise outcomes, but they improve decisions.
Their power lies in distance, discipline, and clarity.
Used correctly, football stops looking like chaos and starts looking like a system with a readable logic.