From Statistics to Strategy: How Data Shapes Betting in Football
Football betting has evolved. It’s no longer about


Football betting has evolved. It’s no longer about gut feelings or picking the team with the flashiest striker. Today, it’s a chess game played with numbers. Data drives almost every decision in professional betting now. Bettors scroll through charts, run models, and decode what xG really says about a team’s performance. Somewhere between player heat maps and shot conversion rates, they find their edge.
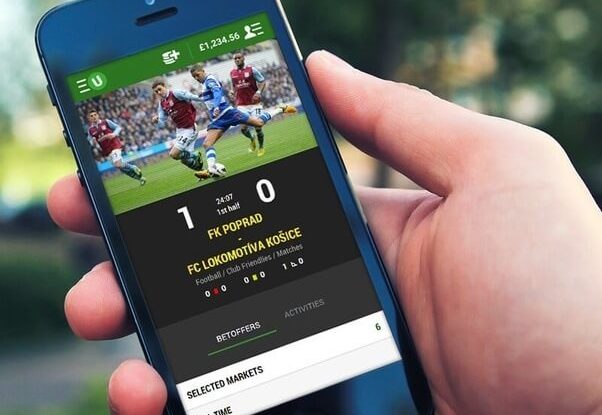
That edge also sharpens when they pick the right platform. For example, the best betting site in Kenya Paripesa offers odds shaped by detailed match data and advanced modeling. Choosing a bookie that leans on data isn't just smart — it’s essential when you're betting based on more than just recent results.
The Rise of xG: Why Expected Goals Matter
Expected Goals (xG) flipped traditional stats on their head. It measures the quality of a scoring chance instead of just counting shots or goals. Not all shots are created equal — an 18-yard screamer under pressure doesn’t carry the same weight as a tap-in at the six-yard line.
Bettors and bookies alike now build models that rely heavily on xG. A team with high xG but few goals? That's often a sleeping giant. The numbers show they’re creating quality chances, and luck just hasn’t turned yet. Vice versa, a team with low xG but lots of goals? That usually screams overperformance, ripe for regression.
Bookmakers adjust odds based on these nuances. You might think a team is flying high, but their xG tells another story — and that reflects in their odds next match.
Three key ways xG impacts betting decisions:
- Unmasking flukes: Teams overperforming their xG are often overvalued.
- Spotting value: Underdogs with strong xG metrics can offer generous odds.
- Predicting market moves: xG trends often shift public sentiment before bookies adjust.
Reading xG isn’t optional anymore. It's table stakes for serious bettors.
Pass Maps & Player Movement: Reading the Invisible
xG is just the start. There’s more beneath the surface. Pass maps, pressing data, and player movement charts give a fuller picture of team dynamics. These aren’t just fancy visuals — they’re signals.
A pass map shows how a team builds its attacks. Is it all through the wings? Do they funnel everything through a creative 10? This helps bettors see where goals may come from, and where they probably won’t.
Player runs also reveal key patterns. A striker who constantly peels off the shoulder, finding gaps between defenders, is a live threat. Tracking his runs tells you where and when chances are most likely.
What to look for in movement data:
- Consistent patterns: Repeated attacking moves suggest a trained tactic.
- Overloads: Teams creating 3-on-2s in wide areas are prepping for crosses or cutbacks.
- Inverted runs: When wide players cut inside, they open up shooting lanes and drag defenders.
This info doesn’t just predict goals. It tells you how the game will unfold. That’s crucial when betting live or pre-match. Sometimes the stats say "under," but the movement screams "goals."
How Bookmakers Use This Data
Bettors aren't the only ones running numbers. Bookmakers have entire teams dedicated to data science. They're not watching the game with snacks. They're modeling it.
Odds are no longer static. They react to:
- Line-up changes: Missing a key ball-progressor or keeper? Watch those odds shift.
- Pre-match data trends: A team facing 20+ shots per game? Their odds balloon.
- Live-game events: Red card? Injury? Bookies adjust in seconds, using pre-built algorithms.
The goal isn’t just to reflect probability. It's to manage liability. If a surge of smart money comes in on a seemingly deadbeat underdog with solid metrics, that line will tighten fast.
Smart bettors watch the odds like traders watch tickers.
The Bettor’s Toolbox: What to Track
To keep up, you need your own toolbox. Good news? Most of it’s free or cheap. Data is everywhere. The real edge is knowing what to look for and how to act on it.
Here’s a shortlist of go-to metrics:
- xG/xA (Expected Goals/Assists): Clear picture of chance quality.
- PPDA (Passes Per Defensive Action): Measures pressing intensity.
- Possession value models: Who adds the most danger per touch?
- Heat maps: Shows zones of activity for players and teams.
And tools to use:
- Wyscout or InStat: Deep scouting data, pro-level insights.
- FBRef & Understat: Free access to xG, passing charts, more.
- SofaScore/WhoScored: Great for live data and momentum tracking.
Final Whistle: Why Data Is a Gamechanger
Football is chaos. One bad bounce, one VAR call, and a bet flips. But when you anchor your picks in data, you're not just guessing. You're investing.
Smart betting isn’t just luck or "knowing football." It’s pattern recognition. Seeing through noise. Knowing that a team with 0.3 xG and two goals probably won't pull it off next week.
Use the numbers. Track the trends. And choose your bookies wisely. Football’s always been a game of inches. Now it's a game of decimals too.